About

Why monitor sales metrics: A real estate pro’s guide
Most real estate professionals think tracking sales metrics means staring at spreadsheets that confirm what they already suspect. That assumption is costing you deals. Knowing why monitor sales metrics matters is the difference between reacting to a slow month and never having one. The agents and brokers who consistently grow their pipelines are not necessarily working harder. They are making decisions backed by data, coaching their teams with precision, and qualifying leads before wasting a single appointment. This guide shows you exactly how to build that advantage.
Table of Contents
- Understanding sales metrics and why they matter
- Establishing an effective sales metric cadence for real estate teams
- Key sales metrics real estate professionals must monitor
- Using sales metrics to improve forecasting and identify bottlenecks
- Best practices and common pitfalls when monitoring sales metrics
- Why most real estate pros misunderstand sales metrics and how to fix it
- Streamline your sales metric tracking with top real estate tools
- Frequently asked questions
Key Takeaways
| Point | Details |
|---|---|
| Real-time insights | Monitoring sales metrics gives early visibility into what’s working and what needs fixing in your sales process. |
| Use leading indicators | Focus on predictive metrics to enable timely coaching and avoid waiting on outcome data. |
| Regular cadence matters | Track metrics weekly, monthly, and quarterly to balance immediate actions with long-term strategy. |
| Qualify your leads | Prioritize tracking qualified leads over total inquiries to build a predictable sales pipeline. |
| Connect metrics to action | Metrics must drive coaching and behavior change to improve sales results effectively. |
Understanding sales metrics and why they matter
Sales metrics are quantifiable measurements that track the health, activity, and outcomes of your sales process. They split into two categories that serve very different purposes.
Leading indicators are predictive. They measure behaviors and activities happening right now, before results materialize. Think outreach calls made, listing appointments scheduled, or qualified leads generated this week. Lagging indicators measure outcomes after the fact: closed transactions, total revenue, average days on market. Both matter, but most teams overweight lagging metrics.
Here is why that imbalance hurts you:
- Lagging indicators tell you what happened, not what is about to happen
- By the time a lagging metric signals a problem, the damage to your pipeline is already done
- Leading indicators enable real-time intervention while there is still time to course-correct
- Relying on lagging data alone means your coaching is always historical and your adjustments are always late
“Monitoring sales metrics is what turns sales from guesswork into decision-making: teams can spot trends and plug gaps across the sales motion.”
Think of your metrics as a real-time radar system. Without it, you are flying blind between closings. With it, you see exactly where deals are stalling, which lead sources are producing, and which agents need support before a bad quarter becomes a bad year. Understanding why monitoring performance matters applies across every sales-driven field, including real estate.
Now that you grasp what sales metrics entail, let’s explore the best way to organize and review them.
Establishing an effective sales metric cadence for real estate teams
Tracking metrics once a quarter is like checking your GPS only when you are already lost. Cadence, meaning how often you review specific metrics, determines whether your data drives action or just fills a dashboard.
Here is a practical framework for real estate teams:
- Weekly reviews focus on leading indicators. Review outreach volume, new qualified leads added, appointments set, and follow-up completion rates. These numbers tell you whether your pipeline is being fed right now.
- Monthly reviews examine completed sales cycles. Look at conversion rates, average transaction value, and how workload is distributed across your team. This is where you assess whether your process is producing consistent results.
- Quarterly reviews are for strategic analysis. Analyze trend lines, ROI by lead source, and pipeline velocity over time. This is where you make decisions about where to invest marketing dollars next.
Weekly metrics provide a micro view for coaching; monthly metrics cover completed cycles; quarterly metrics reveal longer-term trends. The key is matching your review cadence to your sales cycle length. A luxury residential agent closing four transactions per year needs different monthly benchmarks than a broker managing 40 annual transactions.
Real estate-specific cadence considerations include:
- Aligning weekly reviews with your team’s busiest prospecting day, typically Tuesday or Wednesday
- Using monthly reviews to check whether listing appointment conversion rates have shifted
- Building quarterly benchmarks around seasonal market patterns in your local area
- Tracking leading indicators on a regular cadence supports early coaching and operational adjustments
Your weekly sales metrics cadence should feed directly into team meetings where numbers connect to specific conversations, not just reports that get filed away. For broader context on how successful teams structure this rhythm, reviewing operating cadence best practices in real estate gives you a useful benchmark.
With cadence established, let’s examine the most critical sales metrics that real estate professionals should monitor.
Key sales metrics real estate professionals must monitor
Not all metrics deserve equal attention. The most dangerous trap in sales measurement is tracking activity volume without filtering for quality. Fifty cold calls mean nothing if none of them reach qualified buyers.
Here is a comparison of activity metrics versus qualification-focused metrics:
| Activity metric | Qualification-focused metric |
|---|---|
| Total leads received | Qualified leads per week |
| Calls made | Appointments with pre-approved buyers |
| Emails sent | Response rate from target neighborhoods |
| Open house attendees | Attendees matching buyer criteria |
| Social media impressions | Inbound inquiries from defined zip codes |
Qualified Leads Per Week is a North Star metric that filters out tire-kickers and directly predicts pipeline value. When you monitor this number consistently, you stop chasing volume and start building a predictable book of business.
The other metrics worth monitoring closely include:
- Conversion rate by lead source: Tells you which marketing channels deserve more budget and which are burning cash
- Stage-to-stage conversion rates: If prospects consistently drop off between the listing presentation stage and contract signing, you have a pricing or objection-handling problem, not a volume problem
- Appointment-to-offer rate: Stage-to-stage conversion rates identify funnel leaks and provide leading insight into prospecting effectiveness
- Pipeline velocity: How quickly deals move through your funnel affects cash flow forecasting
Understanding real estate funnel conversions at each stage gives you the diagnostic precision to fix the right problem instead of guessing. Pairing this with strong lead qualification metrics means you are building a system, not just tracking numbers.
Pro Tip: If your lead-to-appointment conversion rate looks healthy but your appointment-to-offer rate is weak, the problem is not lead generation. It is what happens in the room. That diagnosis only becomes visible when you track stage-to-stage conversion, not just total volume.
Understanding these key metrics prepares you to use the data for accurate forecasting and identifying sales process bottlenecks.
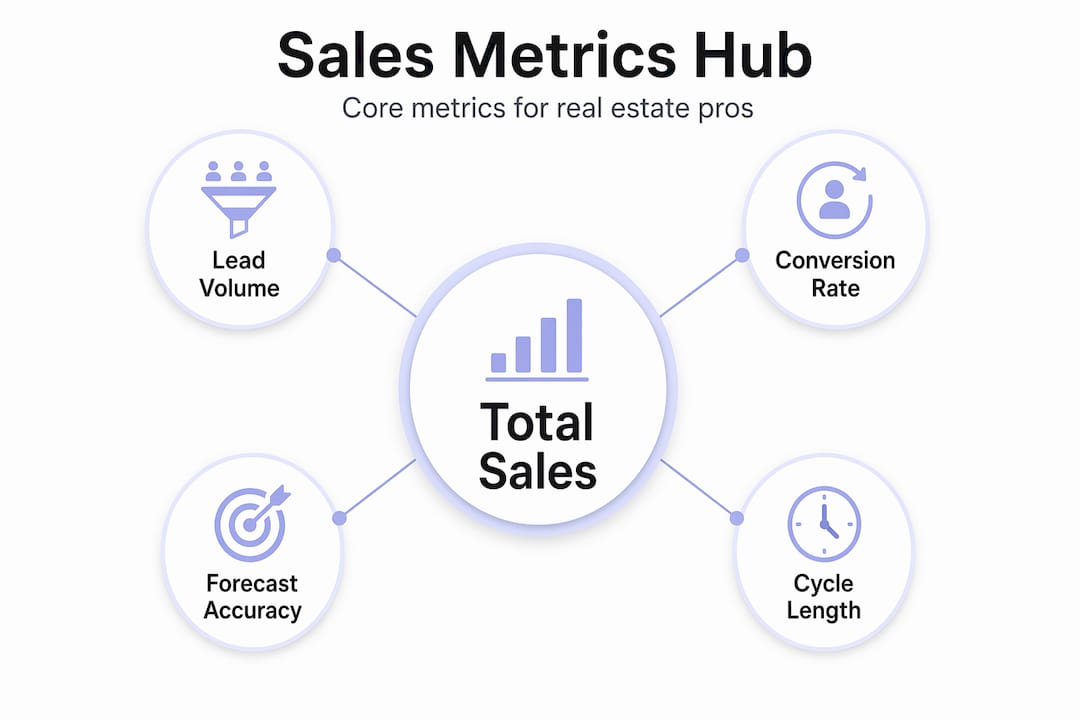
Using sales metrics to improve forecasting and identify bottlenecks
Forecasting in real estate is notoriously difficult. Market shifts, seasonal patterns, and buyer sentiment all create noise. Sales metrics cut through that noise by showing you what your pipeline actually contains right now.

Here is how leading and lagging indicators work together for better forecasting:
| Indicator type | Example metric | Forecasting role |
|---|---|---|
| Leading | Qualified leads added per week | Predicts closings 60-90 days out |
| Leading | Listing appointments set | Predicts inventory pipeline |
| Lagging | Closed transactions this month | Confirms past performance |
| Lagging | Average days on market | Validates pricing strategy |
Sales tracking enables better forecasting by revealing pipeline progress and bottlenecks for timely intervention. When you see that qualified lead volume dropped three weeks ago, you know to expect a softer closing month before it happens. That is the power of leading metrics.
Common bottlenecks that conversion data reveals:
- A sharp drop in conversion between first contact and scheduled appointment often signals a weak follow-up sequence
- Stalling between signed listing agreement and active listing usually points to internal process delays
- Low offer-to-close conversion rates may indicate pricing misalignment or title and inspection issues that need process fixes
- Tracking multiple leading indicators relative to lagging indicators improves forecast accuracy and operational timing
Understanding your real estate sales cycle stages in detail makes this analysis far more precise. You cannot identify a bottleneck in a stage you have not defined.
With forecasting insights in hand, let’s explore common pitfalls and actionable strategies to make your sales metrics work for you.
Best practices and common pitfalls when monitoring sales metrics
The most common failure mode in sales metric tracking is not laziness. It is theater. Teams build impressive dashboards, hold weekly reviews, and still see no improvement in results. The reason: the metrics are disconnected from behavior.
Pitfalls to avoid:
- Dashboard overload: Tracking 30 KPIs means you act on zero. Many teams track too many KPIs, leading to analysis paralysis instead of action
- Reviewing too late: If you only look at metrics after a bad quarter ends, you are doing post-mortems, not management
- Orphaned metrics: Any KPI without a clear owner and defined action trigger is decoration, not a management tool
- Lagging-only focus: Relying entirely on closed deals and revenue numbers keeps you permanently behind the curve
- No connection to coaching: Data alone does not change behavior; metrics must connect to coaching, recognition, and motivation to produce real results
The practical fix is simple but requires discipline. Limit your weekly team review to 7 to 10 metrics that are directly actionable. Assign ownership to each one. Define what number triggers a conversation. Then actually have that conversation.
Recognition matters too. When an agent improves their appointment conversion rate from 30% to 45%, name it publicly and connect it to the metric. That is how data becomes culture.
Pro Tip: Before adding any new metric to your dashboard, ask one question: “What action will I take if this number drops by 20%?” If you cannot answer immediately, do not track it yet.
Connecting metrics to your lead generation strategies means every lead source gets evaluated on the quality it produces, not just the volume.
Why most real estate pros misunderstand sales metrics and how to fix it
Here is the uncomfortable truth: most real estate professionals who track sales metrics are not actually using them. They are collecting data as a form of reassurance, not as a decision-making engine.
The belief that pulling a weekly report equals managing your pipeline is widespread and costly. You can measure everything and change nothing. Connecting metrics to coaching and action is what makes data more than just awareness. Without that link, you have a rearview mirror when you need a windshield.
The second problem is vanity metrics. Total website visitors, social media followers, and raw lead counts all feel meaningful because they grow. But an agent with 500 unqualified leads is in a worse position than one with 50 qualified prospects and a clear follow-up system. Inflated activity numbers mask a thin pipeline until the month closes and the revenue reflects reality.
The fix is a mindset shift. Stop treating metrics as judgment and start treating them as navigation. Your appointment-to-offer ratio is not a grade. It is a diagnostic reading that tells you exactly where to improve. A low ratio is an invitation to refine your presentation, not a verdict on your ability.
The professionals who build lasting pipelines use metrics to answer one question continuously: where in my sales process can I produce the highest return right now? They pair that clarity with effective lead nurturing that keeps qualified prospects warm until they are ready to move. That combination of focused measurement and disciplined follow-through is what separates top producers from agents perpetually chasing volume.
Streamline your sales metric tracking with top real estate tools
The gap between knowing your metrics and acting on them closes fast when you have the right tools in place. Manually pulling data from five different sources guarantees you will review it too late to matter.

At ex.plo.re, we built our platform specifically for agents and brokers who want their prospecting and metric tracking working together in one place. Explore our best real estate prospecting tools to see how automated tracking connects directly to your prospecting and client acquisition workflow. From qualified lead monitoring to pipeline velocity dashboards, our lead generation tools for realtors are built around the metrics that actually move your business forward. Stop managing data manually and start acting on it in real time.
Frequently asked questions
What are leading and lagging sales metrics and why do they matter?
Leading metrics predict future sales performance by capturing behaviors as they happen, enabling real-time coaching, while lagging indicators measure results after the fact and support accountability reviews.
How often should real estate professionals review sales metrics?
Weekly metrics give a micro view for immediate coaching, monthly metrics cover completed sales cycles, and quarterly metrics reveal strategic trends that inform long-term planning and budget decisions.
Why is focusing on qualified leads more important than total lead volume?
The Qualified Leads Per Week metric filters out non-serious prospects and directly predicts pipeline value, ensuring your time and marketing spend go toward people ready to transact.
What common mistakes do sales teams make when tracking metrics?
Retrospective dashboards and metric overload create analysis paralysis, and teams that fail to connect data to specific coaching actions see no behavioral change despite the effort invested in reporting.
How can sales metrics improve forecasting accuracy?
A leading-to-lagging indicator approach improves forecasting accuracy by surfacing early warnings in pipeline activity weeks before they appear in closed transaction data, giving you time to respond.