

Overview: Lead scoring is an objective, data-driven method for ranking prospects by their likelihood to convert — and the single action to take right now is to agree on an MQL threshold with your sales team and build a simple 0–100 score that combines fit and intent. That one conversation will do more for your pipeline than any campaign tweak.
To make it concrete, here is a three-signal starter score:
- +30 points — requested a demo or booked a call (high-intent behavior)
- +10 points — job title matches your ICP (fit signal)
- -20 points — visited your careers page or flagged as a competitor (negative signal)
A lead who hits 80 goes straight to sales. One who sits at 30 goes into a nurture sequence. That is what lead scoring explained looks like in its most practical form: a shared rulebook that tells marketing and sales exactly who is worth calling today.
Table of Contents
- Why does lead scoring matter for your pipeline?
- What data actually feeds a lead score?
- How do you build a lead scoring model step by step?
- Which scoring model type fits your team right now?
- What are the best practices and pitfalls to avoid?
- Lead scoring in action: a sample matrix and routing workflow
- How do you validate and tune your model over time?
- Which platforms support lead scoring in practice?
- Key Takeaways
- The part most teams get wrong about adoption
- How Plo helps real estate teams put scoring to work
- Useful sources for deeper reading
Why does lead scoring matter for your pipeline?
Most sales teams struggle with a large volume of leads and lack a consistent standard for what constitutes a good lead. Lead scoring helps by providing a repeatable, measurable process rather than a subjective judgment.

The business case is straightforward. When sales reps focus on leads above a defined score threshold, response times drop, conversion rates climb, and pipeline forecasting becomes far more reliable. Better still, scoring creates a common language between marketing and sales — a contract, as Oracle frames it, that defines what a quality lead is and sets clear hand-off expectations. That alignment alone eliminates a significant source of friction: the endless debate over whether marketing is sending “bad leads” or sales is failing to follow up.
The pipeline benefits compound quickly. When marketing knows which lead attributes correlate with closed deals, they can optimize campaigns toward those signals. When sales knows a lead’s score before picking up the phone, they can tailor the opening conversation. The result is faster MQL-to-SQL velocity, higher close rates, and a pipeline that is actually forecastable.
One number that matters: Wikipedia’s lead scoring entry notes that optimal predictive models aim for a small percentage of leads to account for a disproportionately large share of conversions — the classic concentration effect that scoring is designed to surface and act on.
For real estate agents and luxury brokers specifically, this matters even more. High-value clients move on their own timeline, and wasting outreach on low-fit inquiries is expensive. Understanding how to qualify buyer leads before scoring them is the foundation that makes the whole model work.
What data actually feeds a lead score?
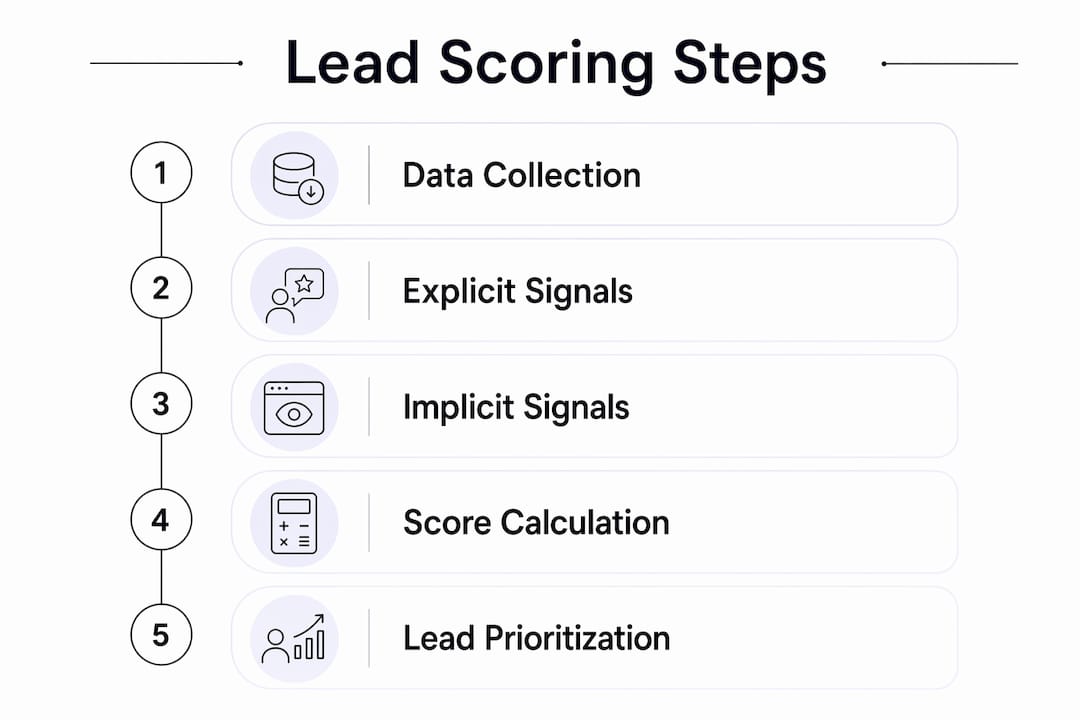
Effective lead-scoring models combine two primary data types: explicit and implicit. Getting both right is what separates a model that predicts conversions from one that just ranks form fills.
Explicit data: who the lead is
Explicit data is profile information — what the lead tells you directly or what you can verify from a third-party source. Think job title, company size, industry, geography, and annual revenue. This is your fit dimension: does this person look like your ideal customer?

For a luxury real estate team, explicit signals might include property budget range, buyer vs. investor status, or whether the contact came through a referral partner. For a B2B SaaS team, it is more likely to be company headcount, tech stack, or funding stage.
Implicit data: what the lead does
Implicit data is behavioral. It captures intent: website visits, email clicks, webinar attendance, content downloads, demo requests, and time spent on pricing pages. A lead who has visited your pricing page three times and opened every email in a sequence is signaling something a job-title match alone cannot tell you.
The critical insight from HubSpot’s lead scoring guidance is that the most common mistake teams make is treating fit and intent as interchangeable. A perfect-fit lead with zero engagement is not the same priority as a good-fit lead who is actively researching. You need both dimensions in your model.
Data quality and enrichment
Raw form data is rarely enough. Tools like ZoomInfo can enrich contact records with firmographic data automatically, filling gaps that prospects leave blank. Oracle Eloqua offers built-in enrichment and reverse-IP lookup to identify anonymous visitors. The fields worth prioritizing for capture: company email domain (filters spam), job title or seniority level, company size, and at least one behavioral trigger like a page visit or content download.
Pro Tip: Set a minimum data threshold before a lead enters scoring at all. A record with only a first name and a Gmail address should never reach your sales queue — build a “lamb or spam” filter as your first gate.
How do you build a lead scoring model step by step?
Simple manual scoring starts with your baseline conversion rate and works outward from there. Here is a repeatable eight-step roadmap you can execute this quarter.
- Define your ICP and baseline conversion rate. Pull the last 12 months of closed-won deals. What do those customers have in common? That is your Ideal Customer Profile. Your baseline conversion rate is the percentage of all leads that became customers.
- Pick 4–6 explicit fit criteria. Job title, company size, industry, geography, and budget range are the most common. Keep it to the signals you can actually capture on a form or enrich from a data source.
- Pick 4–6 engagement signals. Demo requests, pricing page visits, email link clicks, webinar attendance, and content downloads. Weight recency: a visit from yesterday matters more than one from six months ago.
- Calculate attribute-specific close rates. For each signal, compare the close rate of leads with that attribute against your baseline. An attribute with a close rate twice the baseline deserves proportionally higher points.
- Assign relative point weights. A common split is 60% fit and 40% engagement for early-stage models. Assign points so the maximum fit score is 60 and the maximum engagement score is 40, totaling 100.
- Combine fit and engagement into a 0–100 scale. This is your composite lead score. Map score ranges into categories like cold, warm, and hot to direct appropriate follow-up actions.
- Set routing rules and SLA. Define what happens at each threshold. A score of 70+ triggers an immediate sales notification with a 24-hour contact SLA. A score of 41–69 goes to an SDR sequence within 48 hours.
- Document acceptance criteria and the hand-off process. Record the SLA in your CRM so automation can enforce routing. Both teams sign off on the thresholds before launch.
Implementation checklist for CRM and marketing automation
- Form fields to capture: company email, job title, company size, industry, and budget/timeline
- Tracking events to instrument: pricing page visit, demo request, email click, content download, webinar registration
- Enrichment sources to connect: ZoomInfo, Clearbit, or reverse-IP tools for anonymous visitor identification
- Negative scoring rules to add: careers page visit (-15), personal email domain (-20), unsubscribe (-30), competitor flag (-25)
- CRM fields to create: Fit Score, Engagement Score, Composite Score, Score Date, and Routing Status
For real estate teams, lead generation strategies that feed the scoring model matter as much as the model itself. A score built on low-quality inbound traffic will never perform well, no matter how carefully you calibrate the points.
Which scoring model type fits your team right now?
Not every team needs machine learning on day one. The right model type depends on your data maturity, team size, and how much historical conversion data you have to work with.
Rule-based scoring
This is the starting point for most teams. You define the rules, assign the points, and the system applies them mechanically. It is transparent, easy to explain to sales, and fast to deploy. The downside is that it requires manual updates as your ICP evolves and can miss non-obvious patterns in the data.
Rule-based models are the right choice when you have fewer than 1,000 historical conversions, a small marketing team, or a sales cycle short enough that behavioral signals are easy to interpret.
Hybrid scoring
A hybrid approach layers time decay and basic heuristics on top of a rule-based foundation. Time decay automatically reduces a lead’s score when they go inactive for a defined period — say, 30 days without an email open or site visit. Some CRMs offer built-in time-decay features to automate this, which prevents stale leads from clogging the top of your pipeline.
You can also apply a simple offline analysis — decile analysis or basic logistic regression — to refine point weights before committing them to your CRM. This is the practical middle ground for teams that have some conversion data but are not yet ready for a full ML deployment.
Predictive scoring
Predictive lead scoring uses machine learning to generate a model from historical customer data, augmented by third-party sources. Salesforce Einstein, Oracle Eloqua’s predictive scoring module, and similar tools can surface patterns that no human analyst would find manually. The prerequisite is scale: you need labeled outcomes (closed-won and closed-lost deals) in sufficient volume for the model to learn from.
The risk with predictive models is opacity. If your sales team cannot understand why a lead scored 87, they will not trust the score. Build in explainability from the start: show the top three contributing factors alongside the score in your CRM.
When to move from rule-based to predictive: you have 2,000+ labeled outcomes, your rule-based model has plateaued in predictive accuracy, and you have a data analyst or a platform with a built-in ML module. Until then, a well-tuned hybrid model will outperform a poorly configured predictive one every time.
What are the best practices and pitfalls to avoid?
The most common failure mode in lead scoring is not a bad model. It is a model that nobody updates. Teams spend weeks building a scoring framework, launch it, and then let it run untouched for 18 months while their ICP shifts and their conversion patterns change.
Governance essentials
Assign a single SLA owner for the scoring program — usually the head of marketing operations or a revenue operations lead. Set a quarterly review cadence and document who has the authority to change point values. Without this, scores drift out of alignment with reality and sales stops trusting them.
Best-practices checklist
- Split fit and engagement into separate sub-scores before combining them
- Include negative scoring rules for disqualifying signals
- Apply time decay to engagement scores for leads inactive beyond a defined period to maintain score relevance.
- Document every threshold and the action it triggers
- Run closed-loop analysis quarterly: compare score at hand-off to actual close rate
Common pitfalls
Set-and-forget scoring is the biggest one. The second is no negative points — without them, a lead who visits your careers page and unsubscribes from every email can still accumulate enough positive signals to land in your sales queue. The third pitfall is deploying a predictive model with no explainability layer, which destroys sales trust almost immediately.
Pro Tip: Run a weekly 15-minute feedback loop with one sales rep for the first 60 days after launch. Ask one question: “Did the leads you called this week match the score they had?” That single conversation will surface calibration issues faster than any dashboard.
Lead scoring in action: a sample matrix and routing workflow
Here is a filled scoring matrix you can copy, adapt, and load into your CRM or marketing automation platform today.
| Signal | Type | Points |
|---|---|---|
| Requested a demo | Engagement | +30 |
| Visited pricing page (2+ times) | Engagement | +20 |
| Opened 3+ emails in sequence | Engagement | +10 |
| Attended a webinar | Engagement | +15 |
| Job title matches ICP | Fit | +20 |
| Company size matches ICP | Fit | +15 |
| Industry matches ICP | Fit | +15 |
| Budget/timeline confirmed | Fit | +10 |
| Visited careers page | Negative | -15 |
| Personal email domain | Negative | -20 |
| Unsubscribed from email | Negative | -30 |
| Competitor flag | Negative | -25 |
The maximum positive score is 135, but in practice most leads cap out well below 100. Normalize your scoring so that a realistic “hot” lead lands between 70 and 100 on your composite scale.
Routing workflow
- Score 70–100 (Hot): Immediate alert to field sales rep; 24-hour contact SLA; automated task created in CRM
- Score 41–69 (Warm): Routed to SDR queue; 48-hour outreach SLA; enrolled in personalized email sequence
- Score 0–40 (Cold): Enters lead nurturing sequence; re-scored weekly; escalated if score crosses 41
A lead’s journey through the matrix
A luxury real estate inquiry comes in via a listing inquiry form. The contact has a corporate email (+0 negative), lists “Buyer” as their role (+20 fit), and their budget range matches your ICP (+10 fit). They visit the pricing page twice over the next three days (+20 engagement) and open two emails in your follow-up sequence (+0, threshold not yet met). Composite score: 50. They sit in warm nurture.
Two days later they request a showing (+30 engagement). Score jumps to 80. The CRM fires an alert to the listing agent with a 24-hour SLA. That is the model working exactly as designed.
How do you validate and tune your model over time?
Teams that adjust scoring rules based on historical conversion data — not intuition — consistently see higher conversion rates. Tuning is not a one-time event; it is the ongoing practice that keeps your model predictive.
- Run a closed-deal analysis quarterly. Pull all closed-won deals from the past 90 days. What was their score at the point of hand-off? If your top-scoring leads are not closing at a higher rate than mid-tier leads, your point weights are off.
- Track three core KPIs monthly. MQL-to-SQL conversion rate, lead-to-opportunity close rate, and average time from MQL to first sales contact. These three metrics will tell you whether scoring is actually improving pipeline velocity.
- Run a lift test when you change point weights. Route 20% of leads using the old model and 80% using the new one for 30 days. Compare MQL-to-SQL rates between the two groups. This is the cleanest way to validate a change before committing it fully.
- Apply time decay on a rolling basis. Leads inactive for 30+ days should have their engagement score reduced automatically. Check your CRM’s decay settings and confirm they are firing correctly each month.
- Recalibrate after major campaign changes. A new content offer, a new ad channel, or a change in your ICP definition will shift the distribution of your scores. Treat each significant change as a trigger for a mini-calibration.
Pro Tip: For small teams without a data scientist, start with a simple proxy metric: compare the average score of leads that became opportunities against the average score of leads that went cold. If the gap is less than 20 points, your model is not discriminating well enough and you need to revisit your point weights.
For teams using AI-driven tools in real estate finance, AI-powered lender matching platforms offer a useful parallel: the same principle of scoring inputs against historical outcomes applies whether you are matching leads to sales reps or borrowers to lenders.
Which platforms support lead scoring in practice?
Lead scoring lives at the intersection of your CRM, your marketing automation platform (MAP), and your data enrichment layer. The feature types to look for in each category:
- Rule engines: most MAPs (including Oracle Eloqua) have built-in rule-based scoring modules where you define conditions and point values; the platform applies them automatically on record update
- Predictive scoring modules: Salesforce Einstein and Oracle Eloqua’s advanced scoring tier use ML to generate predictive scores from historical CRM data; both require a minimum volume of labeled outcomes to activate
- Enrichment and reverse-IP: ZoomInfo integrates with most major CRMs to auto-populate firmographic fields; reverse-IP tools identify anonymous visitors and match them to company records for scoring before a form fill
- Event tracking: behavioral signals (page visits, email clicks, content downloads) require a tracking pixel or event API connected to your MAP; confirm that events fire into the scoring engine in near real-time, not on a 24-hour batch sync
- Time-decay automation: Zapier-based workflows or native CRM automation can reduce engagement scores on a schedule; confirm the decay rule fires on inactivity, not on a fixed calendar date
Common stack patterns
A lightweight rule-based setup typically lives entirely in the MAP, with scores synced to the CRM on a field update. A hybrid model often has the rule engine in the MAP and the decay logic in the CRM via workflow automation. Full predictive scoring usually requires a dedicated scoring module (Salesforce Einstein, Eloqua’s predictive tier) or a custom data science pipeline feeding scores back into the CRM via API.
The most common sync pitfall: a 24-hour batch sync between MAP and CRM means a lead who requests a demo at 9 AM may not appear in the sales queue until the following morning. For high-intent signals, configure a real-time webhook or near-real-time sync to avoid that delay.
Key Takeaways
Lead scoring works when fit and intent are scored separately, thresholds are agreed on by both marketing and sales, and the model is recalibrated quarterly against actual conversion data.
| Point | Details |
|---|---|
| Combine fit and intent | Score explicit profile data and behavioral engagement separately, then combine into a single 0–100 composite. |
| Use negative scoring | Subtract points for disqualifying signals like careers page visits, unsubscribes, and competitor flags to keep your sales queue clean. |
| Define SLAs at each threshold | Document what happens at every score band (e.g., 70+ = 24-hour contact SLA) and enforce it through CRM automation. |
| Tune quarterly with real data | Compare closed-won scores against closed-lost scores every 90 days and adjust point weights based on actual close rates, not assumptions. |
| Plo accelerates the process | Real estate and luxury broker teams can implement scoring workflows faster with Plo’s CRM, lead generation, and sales automation tools built for high-value pipelines. |
The part most teams get wrong about adoption
Here is something that rarely makes it into the how-to guides: the scoring model itself is almost never the problem. The problem is the meeting that never happened before launch.
Marketing builds a model, sets an MQL threshold at 65, and hands it to sales. Sales looks at the first batch of “hot” leads and says half of them are junk. Marketing says the model is working fine. And then the whole program quietly dies because nobody agreed on what “good” actually meant before the first lead was scored.
The fix is not a better algorithm. It is a 90-minute alignment session where marketing and sales sit down with the last 50 closed-won deals, agree on the three or four signals that actually predicted a close, and set the MQL threshold together. That shared ownership is what makes sales trust the score enough to act on it.
Start with a small pilot: pick one segment, one scoring model, and one sales rep. Run it for 30 days with a weekly feedback loop. When that rep starts asking for more scored leads instead of complaining about quality, you have proof of concept. Then scale.
The governance piece matters just as much as the calibration. Assign one person to own the model. Set a quarterly review date on the calendar before you launch. And document every threshold in the CRM so there is no ambiguity about what should happen at 70 vs. 50. Scoring programs that survive their first year almost always have one person who treats the model like a product, not a project.
How Plo helps real estate teams put scoring to work
Real estate agents and luxury brokers already know their best clients when they see them. The challenge is building a system that surfaces those clients automatically, before a competitor calls first.
Plo’s platform combines CRM, lead generation, sales automation, and AI ad creation into a single workflow built specifically for real estate agents, yacht brokers, and luxury sales teams. That means your scoring signals — form fills, listing inquiries, email engagement, and ad clicks — all feed into one place, with no manual syncing between disconnected tools. Managed onboarding means your team is not configuring a scoring model from scratch; Plo’s expert team helps you define your ICP, set your thresholds, and build the routing rules that match your sales process.
For teams that want to move fast without hiring a marketing operations specialist, that is the real advantage. You get a working scoring and nurture workflow in weeks, not quarters. Explore Plo’s prospecting tools for real estate or book a demo call to see how the platform fits your pipeline.
Useful sources for deeper reading
- Wikipedia: Lead Scoring — Best for conceptual framing, methodology types (ICP, rule-based, predictive), and the mathematical logic behind predictive model performance metrics.
- Oracle: What Is Lead Scoring? — Best for understanding the fit/intent split, operationalizing score thresholds, and the organizational alignment framing (scoring as a contract between marketing and sales).
- HubSpot: Lead Scoring Instructions — Best for the step-by-step calculation method: how to compute attribute-specific close rates and translate them into point values.
- TechTarget: Lead Scoring Definition and Best Practices — Best for iterative tuning guidance and the case for data-driven recalibration over intuition-based adjustments.
- Salesforce: Lead Scoring Overview — Best for understanding the prerequisites and trade-offs of moving from rule-based to predictive (ML) scoring, including platform-specific considerations.
- Zapier: Lead Scoring Implementation Tips — Best for practical automation patterns: time-decay setup, webhook triggers, and connecting scoring logic across tools in a lightweight stack.