A Balanced Market
Home values in Orange County are up only 1.2% over the past year.
Despite a once-in-a-century pandemic, buyers lined up in long lines that wrapped around the block, respectfully maintaining the recommended 5-foot distance behind the buyer in front of them, donning masks, and waiting their turn to tour a home that had just hit the market hours earlier. The catalyst was record-low mortgage rates and a historically low supply of available homes. Many homes permitted buyers to view a home for a couple of hours on Saturday and agreed to respond to all offers on the following Tuesday. It was common for sellers to receive 20, 30, or sometimes more offers to purchase. A bidding war ensued. To become the winning bidder, buyers often stretch above the asking price. It seemed that the sky was the limit on prices. As a result, home values skyrocketed higher, up 8.2% in 2020, 15.2% in 2021, and 10.5% in 2022.
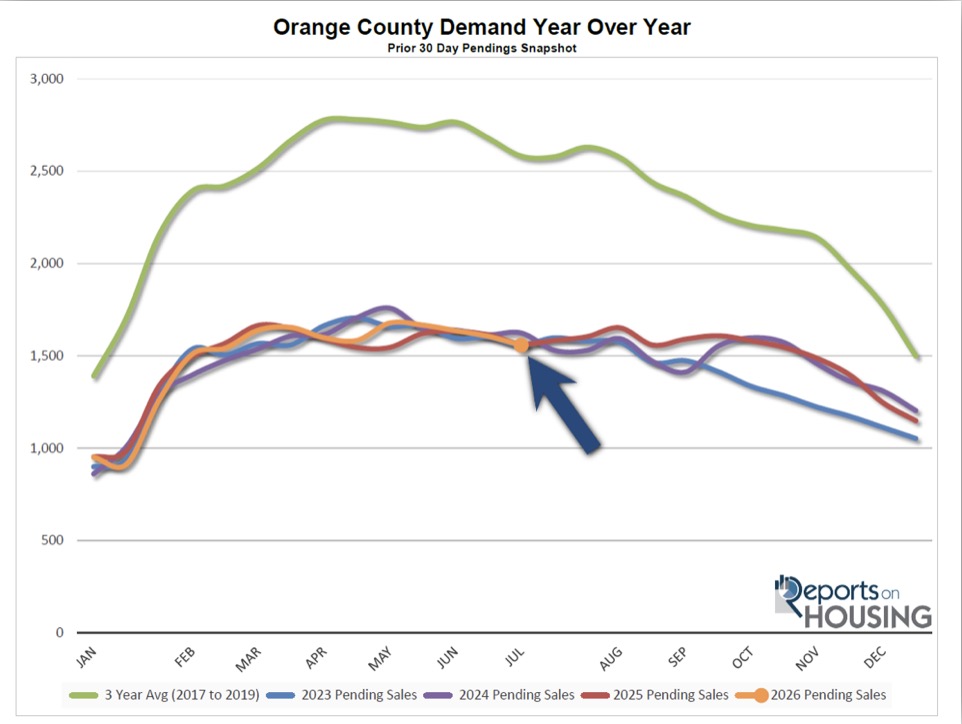
The Federal Reserve stepped in and started raising rates in March 2022. In response to higher rates, the Zillow Home Price Index shows values initially dropped by 5.4% from June 2022 through March 2023. In July 2023, buyer demand (a snapshot of the number of new pending sales over the prior month) was down 42% compared to the 3-year average before the pandemic (2017-2019), but the inventory was down 66%. Home values rose 7.6% in 2023, even though January through March were negative months. In July 2024, demand was down 39% from the 3-year average, and inventory was down 54%. Home values increased by 8.3%. In July 2025, demand was 42% lower than the 3-year average, and the inventory was 27% lower. With additional supply and very similar year-over-year demand, home prices were flat, down 0.2% year over year.
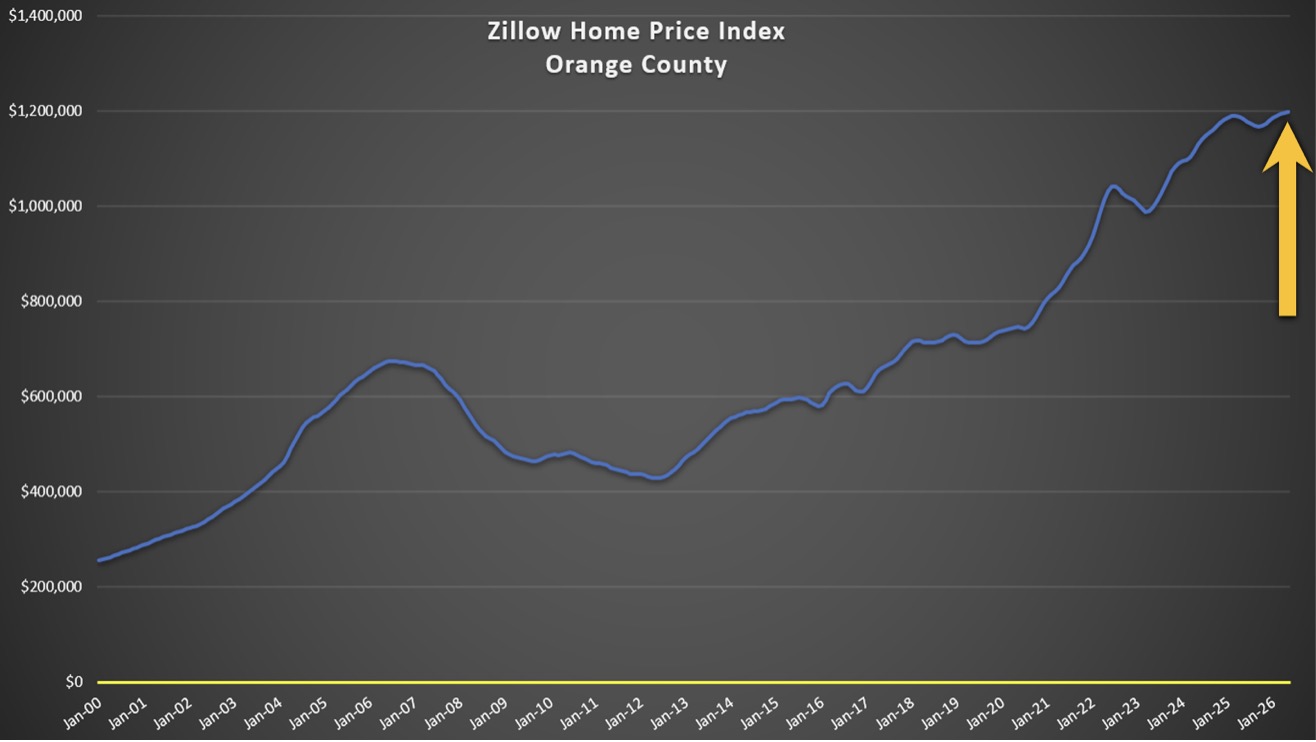
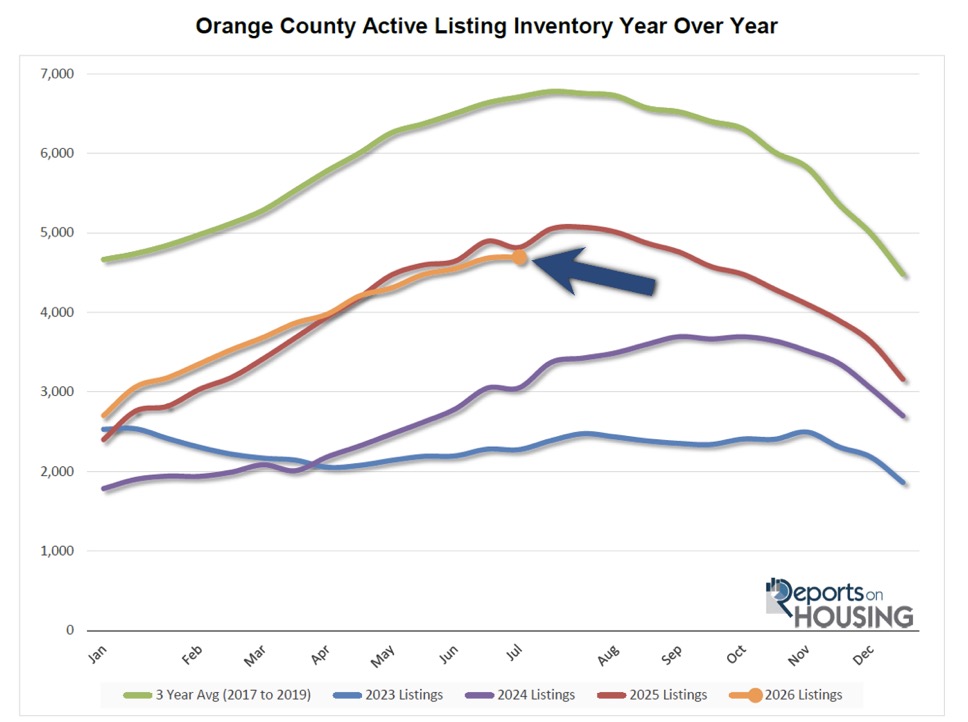
Home values rose in 2023 despite much higher mortgage rates. The very low demand (1,560 pending sales in July) was matched by a chronically low supply of available homes (2,276 in July). In 2024, demand remained at 2023’s very low levels (1,624 pending sales in July), yet the increase in the inventory (3,052 in July) was not enough to stop the rise in values. In 2025, low demand persisted (1,565 pending sales), and the inventory finally rose enough (4,817 in July) to stall home price appreciation. The additional supply tilted the scale away from a seller’s market. The scale is now fairly balanced, not really favoring sellers or buyers. It has reached a plateau. Demand is currently at 1,558, nearly identical to last year. The supply of available homes is 4,697 today, down 120, or 3%, from a year ago. That’s not much of a difference.
Looking at home values in Orange County monthly shows a bit more volatility. In 2025, they were up from January through March, turned negative from April through September, and then were positive to close out the year. Overall, they were flat, changing only slightly from month to month. This year, home values have been positive for the first five months, up 0.5% in January and February, 0.4% in March, 0.1% in April, and only 0.06% in May. From here, it looks as if values will remain flat overall in 2026.
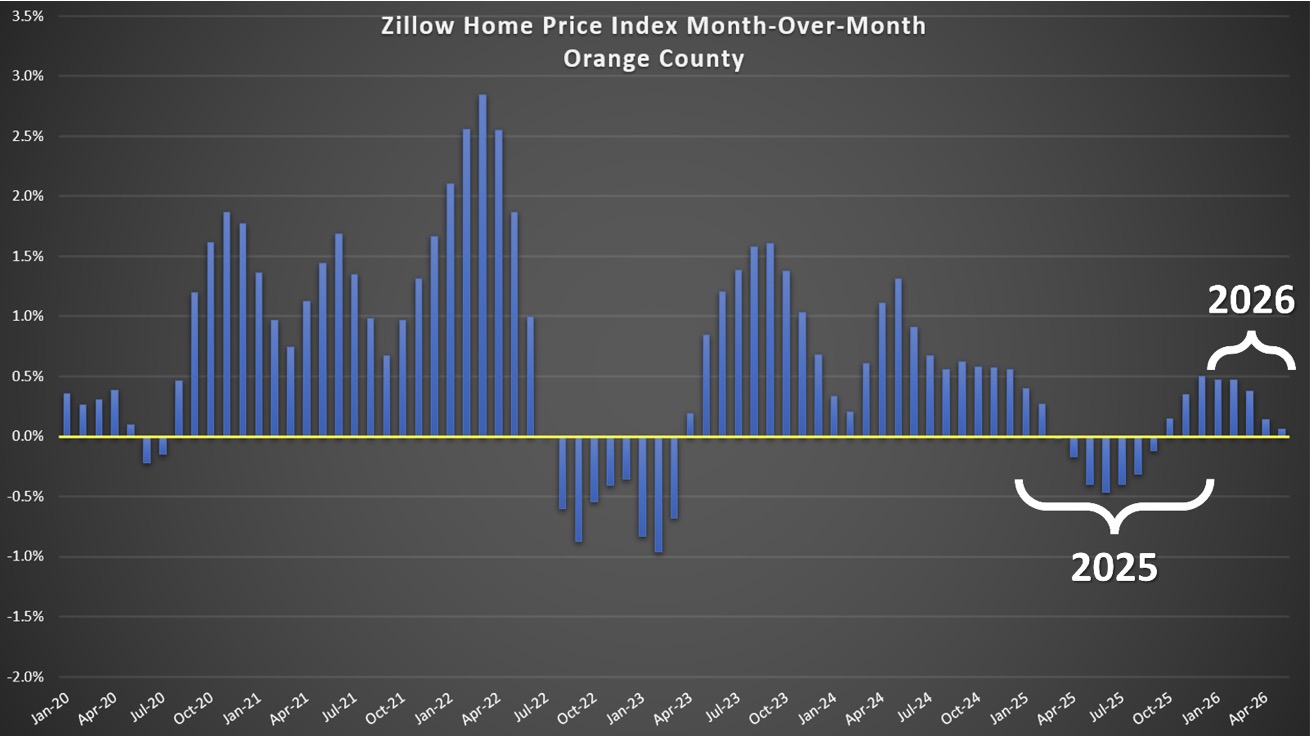
At this point, mortgage rates have proven to be the gas pedal for the housing market. With supply elevated relative to 2023 and 2024, demand increases when rates drop below 6.5% and move towards 6%, as home affordability improves. That is the equivalent of stepping on the gas pedal, and the housing market speeds up. Demand rises, pushing the market further in the seller’s favor. Rates dropped below 6.5% in September of last year, and they remained there through April, with very few exceptions. That explains home values turning positive from October 2025 to May of this year. With rising inflation due to the conflict in Iran, mortgage rates have popped above 6.5% and have remained there since mid-May. That is like letting off the gas. Values start to decline, and the housing market slows.
Any changes in supply will also alter market speed and whether the market favors buyers or sellers. There have been fewer homes available this year compared to last year since May (currently 2% lower than July 2025). If the inventory levels fall considerably below last year’s, the pressure on prices to rise increases. If it climbs considerably higher, as it did in 2025, the pressure for prices to fall increases.
For now, the housing market is balanced. Orange County housing values have plateaued.
Active Listings
In anticipation of the 4th of July holiday weekend, the inventory was nearly unchanged.
Demand
Demand decreased by 3% in the past couple of weeks.
Expected Market Time
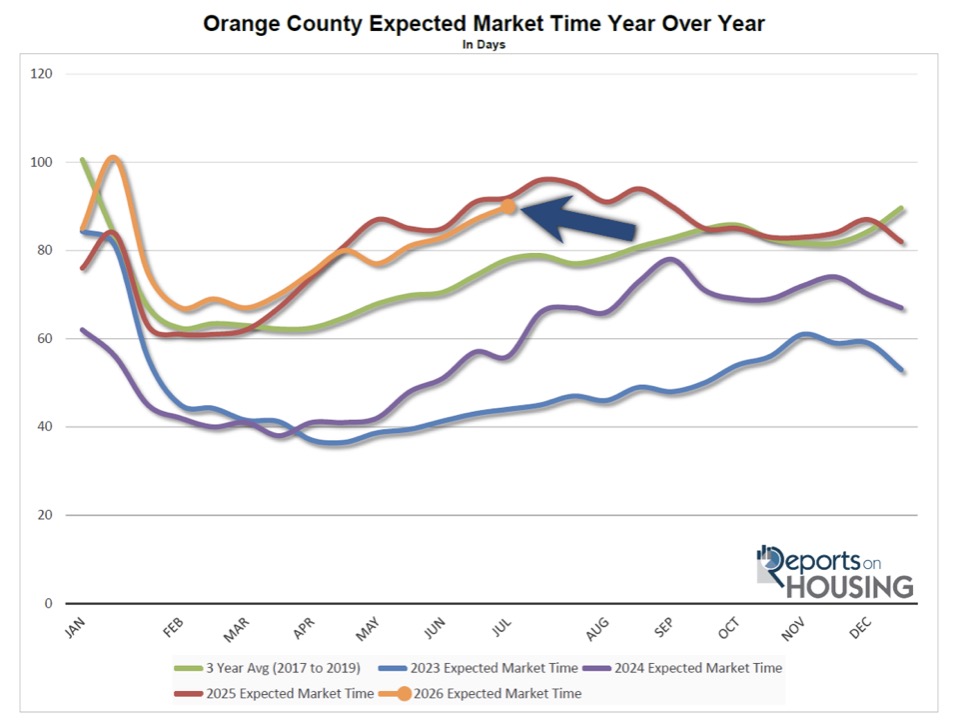
In the past two weeks, the market slowed by three days.
Bottom Line: Whether you are buying or selling, the current market presents strategic opportunities. Call me at 949.287.1021 to discuss how to achieve your real estate goals.
Calendar
Featured Listings

44 Bed | 22 Bath
$8,800,000
17062 B Lane
$8,800,000
Huntington Beach CA

23 Bed | 18 Bath
$5,300,000
1800 W Glencrest Avenue
$5,300,000
Anaheim CA

20 Bed | 20 Bath
$1,100,000
15081 Van Buren Street
$1,100,000
Midway City CA

20 Bed | 14 Bath
$4,400,000
13211 Nelson Street
$4,400,000
Garden Grove CA

17 Bed | 17 Bath
$2,500,000
35025 -35065 Highway 79
$2,500,000
Warner Springs CA

16 Bed | 12 Bath
$7,790,000
20780 20784 Fortuna Del Norte
$7,790,000
Elfin Forest CA

16 Bed | 17 Bath
$4,870,000
7796 LIBERTY
$4,870,000
Huntington Beach CA

15 Bed | 16 Bath
$17,000,000
16757 Old Guejito Grade Road
$17,000,000
Escondido CA

14 Bed | 6 Bath
$3,800,000
758 W 20th Street
$3,800,000
Costa Mesa CA

12 Bed | 20 Bath
$52,000,000
24331 Coto de Caza Drive
$52,000,000
Coto de Caza CA

12 Bed | 10 Bath
$4,999,999
577 Sleeping Indian Rd
$4,999,999
Oceanside CA

11 Bed | 8 Bath
$1,325,000
1609 N Parsons Pl
$1,325,000
Santa Ana CA

10 Bed | 9 Bath
$5,800,000
33408 Sandy Creek Lane
$5,800,000
Pine Valley CA

10 Bed | 14 Bath
$29,500,000
15651 Puerta Del Sol
$29,500,000
Rancho Santa Fe CA

10 Bed | 12 Bath
$16,888,888
12 Morning Dove
$16,888,888
Laguna Niguel CA

10 Bed | 8 Bath
$999,000
22228 Crestline Road
$999,000
Palomar Mountain CA

10 Bed | 17 Bath
$87,500,000
1900 Spindrift Dr
$87,500,000
La Jolla CA

10 Bed | 7 Bath
$3,499,900
16108 16110 Old Guejito Grade Rd Road
$3,499,900
Escondido CA

10 Bed | 8 Bath
$95,000,000
32229 Coast Hwy
$95,000,000
Laguna Beach CA

10 Bed | 8 Bath
$2,729,999
28342 Shadowland Circle
$2,729,999
Silverado CA

10 Bed | 12 Bath
$7,625,000
506 Clubhouse Avenue
$7,625,000
Newport Beach CA

10 Bed | 10 Bath
$13,000,000
1337 Gaviota Drive
$13,000,000
Laguna Beach CA

10 Bed | 11 Bath
$14,999,999
525 Sleeping Indian Rd
$14,999,999
Oceanside CA

9 Bed | 5 Bath
$6,498,800
1409 S Pacific Street
$6,498,800
Oceanside CA

9 Bed | 14 Bath
$15,495,000
5893 Winland Hills Dr
$15,495,000
Rancho Santa Fe CA

9 Bed | 13 Bath
$45,000,000
6853 Rancho Valencia Rd.
$45,000,000
Rancho Santa Fe CA

9 Bed | 10 Bath
$30,999,999
701 1st Street
$30,999,999
Coronado CA

9 Bed | 6 Bath
$2,395,000
14671 Mussey Grade Rd
$2,395,000
Ramona CA

9 Bed | 6 Bath
$2,195,000
426 Grant Street
$2,195,000
Oceanside CA

9 Bed | 12 Bath
$17,500,000
7029 Las Colinas
$17,500,000
Rancho Santa Fe CA

9 Bed | 11 Bath
$12,000,000
10 Old Ranch Road
$12,000,000
Laguna Niguel CA

9 Bed | 12 Bath
$12,995,000
21 Ridgeline Drive
$12,995,000
Newport Beach CA

9 Bed | 6 Bath
$5,249,900
5140 Los Robles Drive
$5,249,900
Carlsbad CA

9 Bed | 13 Bath
$45,000,000
6853 Rancho Valencia Road
$45,000,000
Rancho Santa Fe CA

9 Bed | 7 Bath
$2,249,000
7571 Amazon Drive
$2,249,000
Huntington Beach CA

9 Bed | 14 Bath
$15,495,000
5893 3 Winland Hills Dr
$15,495,000
Rancho Santa Fe CA

9 Bed | 6 Bath
$1,590,000
315 W Cypress Avenue
$1,590,000
El Cajon CA

9 Bed | 11 Bath
$8,550,000
26042 Flintlock
$8,550,000
Laguna Hills CA

8 Bed | 9 Bath
$5,595,000
18050 Rancho La Cima Corte
$5,595,000
Rancho Santa Fe CA

8 Bed | 8 Bath
$13,995,000
2800 Ocean Front
$13,995,000
Laguna Beach CA