

Not a Lot of Change
2026 looks a lot like last year, with some subtle differences.
Everyone has an opinion on the direction of the housing market. In looking for answers, many turn to ChatGPT, YouTube, Google, or Instagram. The results only add to the confusion, especially with so many clickbait headlines designed to increase views and revenue. It is best to take a step back from all of the opinions and noise and turn to the facts and trends that have surfaced in 2026:
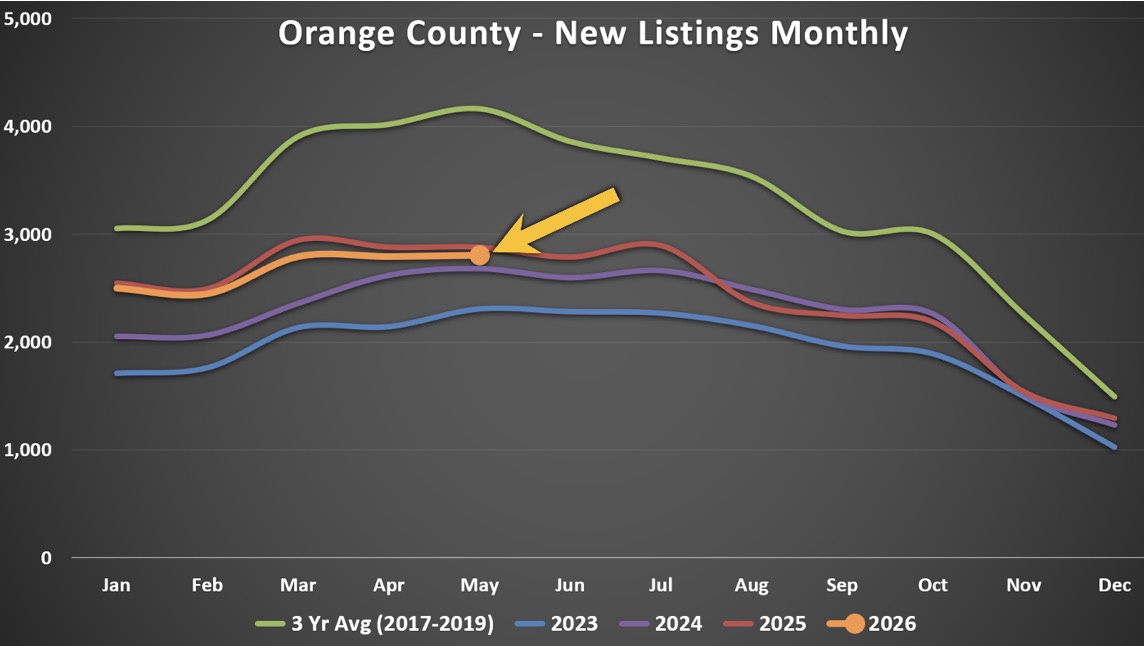
- New Listings – There are slightly fewer sellers this year compared to 2025. Homeowners continue to “hunker down” in their homes, unwilling to move because of their underlying, locked-in, low fixed-rate mortgage. This trend has eased from the lows established in 2023. There were 41% fewer homes listed for sale in 2023 than the 3-year average before the pandemic (2017-2019). That diminished to 31% fewer in 2024 and 26% fewer in 2025. The trend of increasing sellers from year to year ended in 2026. Through May, 13,342 sellers came to market, 489 fewer than last year. It is still 13% more than 2024, and 33% higher than 2023; yet, there are 4,937 missing sellers compared to the 3-year average, 27% fewer. Inventory had been growing year over year because additional sellers were matched against unchanging, muted demand. With slightly fewer sellers this year, the annual inventory growth has ended as well. The trend of slightly fewer sellers than last year should continue for the remainder of 2026.
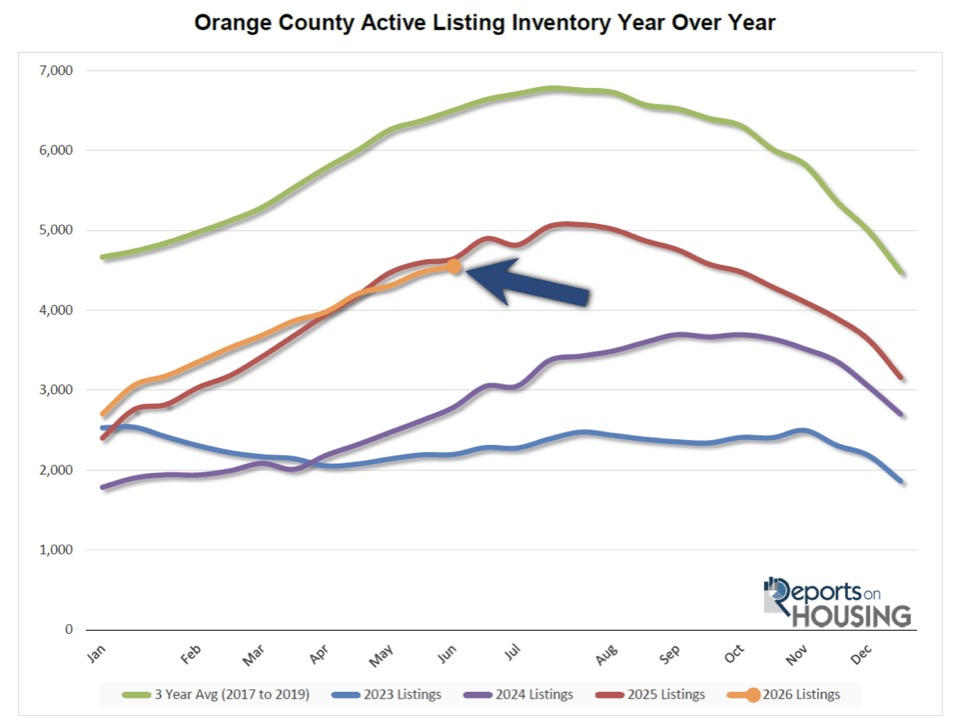
- Inventory – Starting in May, for the first time since March 2024, there are fewer homes on the market this year compared to last year. There were 13% more homes in January 2026 than in January 2025. That changed in March. There are now 2% fewer homes than last year (-94). After starting the year with 2,703 homes, the highest level since 2020, the inventory of available homes increased by 1,848 (+68%) to 4,551. The inventory has not yet reached a peak, but is expected to sometime over the summer between July and August. From there, it will slowly decrease for the remainder of the year. The inventory will drop fast in December during the holiday season when the fewest number of homes come on the market, and many unsuccessful sellers will throw in the towel and pull their homes off the market.
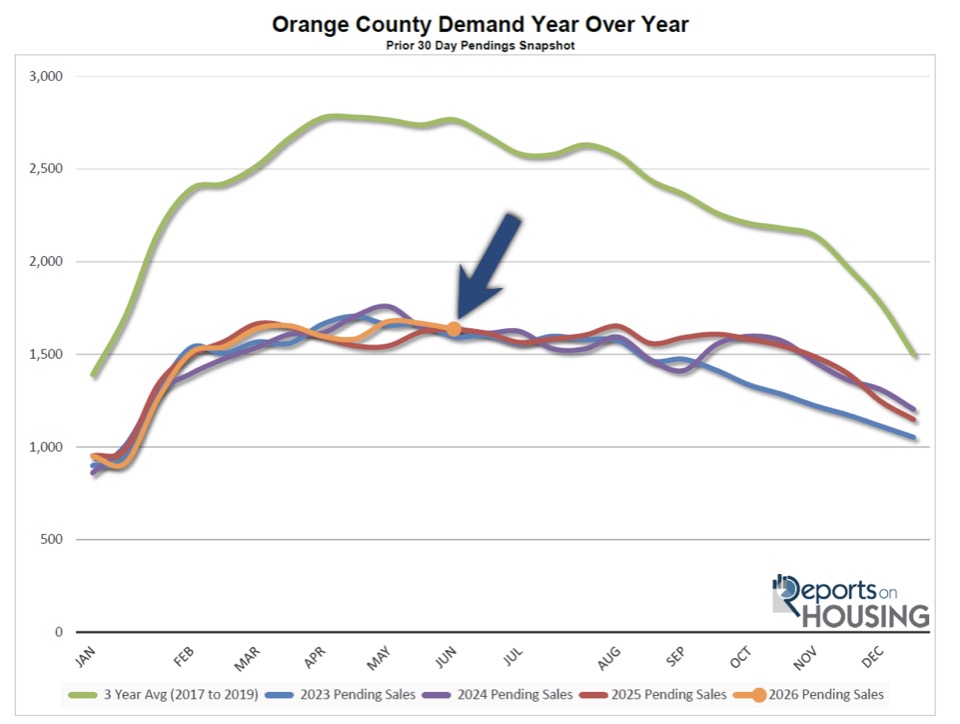
- Demand – Buyer activity remains low due to affordability constraints and has not changed much since 2023. Demand (number of new pending sales over the prior month) increased rapidly from mid-January through mid-February, up 65% from 914 to 1,510 pending sales, then grew slowly from week to week and appears to have reached its annual peak at the start of May at 1,678. Currently, demand is at 1,637 pending sales, which is not much different than previous years. It was 1,633 last year, 1,640 in 2024, and 1,595 in 2023. As long as rates remain between 6.5% and 7%, do not expect demand to change much and break higher. Buyer demand will remain relatively flat through August, and then will slowly fall for the remainder of the year. It will pick up steam during the holidays, when demand drops to its lowest level of the year.
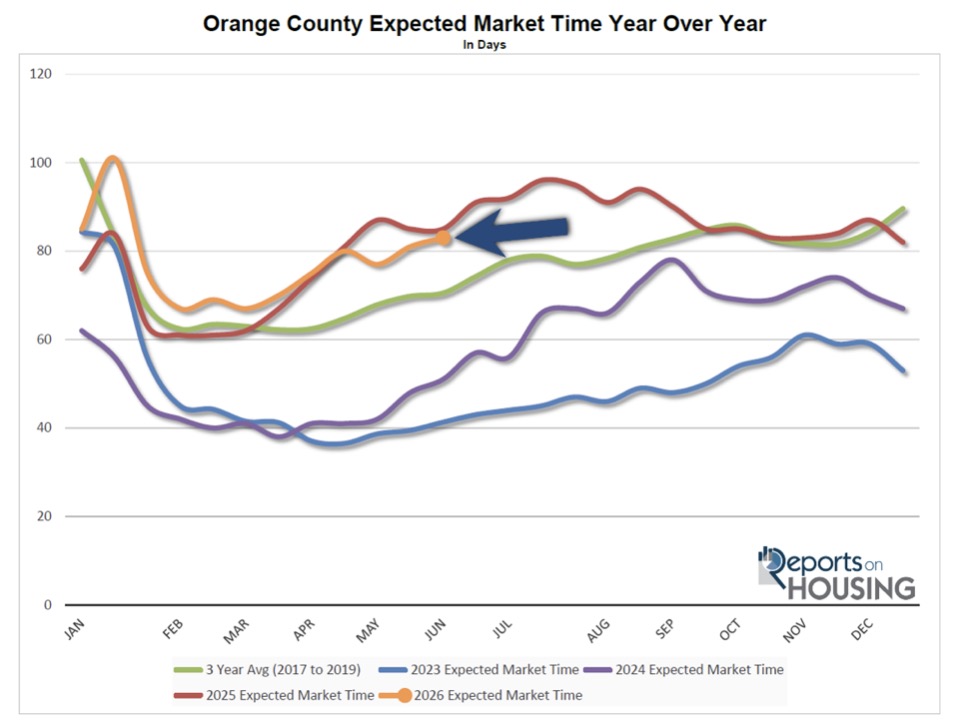
- Expected Market Time – The Orange County housing market is at a better balance, where proper pricing is crucial in securing success. The hottest price ranges are detached homes priced below $1.5 million. When sellers carefully arrive at a home’s asking price, success can be quick. Yet, for much of the market, it is far from instant. After eclipsing 100 days in mid-January, the Expected Market Time (the number of days it takes to sell all Orange County listings at the current buying pace) dropped to 67 days in February and March. With the number of homes coming to market outpacing buyer demand, the Expected Market Time has been slowly increasing since March. Currently, it is at 83 days. It dropped below last year’s level in April and has remained slightly faster than 2025 ever since. Last year, it was at 85 days (+2). It was 51 days in 2024 (-32), and 41 days in 2023 (-42). At 83 days, the market is far from instant. From here, expect the market to continue to slow until the inventory peaks. It will remain elevated for the remainder of the year.
- Delisted Homes – An elevated number of sellers are pulling their homes off the market, a strong indicator that most sellers do not have to sell. Through May, 2,939 sellers have pulled their homes off the market. That is 13% higher than last year’s 2,591. In 2024, 1,445 homes were pulled off the market (-50%), and it was 1,712 in 2023 (-42%). This is the highest level since 2020, the start of the pandemic (2,962). The lack of success among many sellers, even after reducing their asking prices, has led to an increase in the number of delisted homes. It reveals that many sellers are unwilling to lower their asking price to a level low enough to secure a sale.
- Mortgage Rates – Buyer demand was poised to take off during the spring, with rates dropping to 6% in February, but the Iran conflict resulted in rates eclipsing 6.5%. Mortgage rates were bouncing between 5.99% and 6% during the last week of February, poised to drop into the 5s for the first time since August 2022. An extremely weak job report was released on Friday, March 6th, which would have resulted in rates falling to about 5.85%. That did not occur because of the immediate impact of rising fuel prices upon the start of the Iran conflict on Saturday, February 28th. Mortgage rates had been permanently parked between 6% and 6.5% from September 3rd of last year to the start of the conflict. Amid fears of inflation, rates climbed and surpassed 6.5% by the third week of March. According to Mortgage News Daily, they are at 6.68% today. Housing is very rate-sensitive. Mortgage rates are the gas pedal for the housing market. When rates fall below 6.5%, it is like pushing on the gas pedal. The lower the rates fall, the faster the market will move, driven by elevated demand as affordability improves. Similarly, as rates climb and surpass 6.5%, market activity slows due to growing affordability challenges. In the absence of the Iran conflict, buyer demand would have surpassed the frozen grip of the past few years. Instead, expect the market’s pace to closely resemble last year’s.
Active Listings
The inventory increased by 2% in the past couple of weeks.
Demand
Demand decreased by 2% in the past couple of weeks.
Bottom Line: Whether your looking to buy or sell, today’s market presents strategic opportunities. Call Amelie at 949.287.1021 to discuss your real estate goals.
Calendar
Featured Listings

44 Bed | 22 Bath
$8,800,000
17062 B Lane
$8,800,000
Huntington Beach CA

23 Bed | 18 Bath
$5,300,000
1800 W Glencrest Avenue
$5,300,000
Anaheim CA

20 Bed | 20 Bath
$1,100,000
15081 Van Buren Street
$1,100,000
Midway City CA

20 Bed | 14 Bath
$4,400,000
13211 Nelson Street
$4,400,000
Garden Grove CA

17 Bed | 17 Bath
$2,500,000
35025 -35065 Highway 79
$2,500,000
Warner Springs CA

16 Bed | 12 Bath
$7,790,000
20780 20784 Fortuna Del Norte
$7,790,000
Elfin Forest CA

16 Bed | 17 Bath
$4,870,000
7796 LIBERTY
$4,870,000
Huntington Beach CA

15 Bed | 16 Bath
$17,000,000
16757 Old Guejito Grade Road
$17,000,000
Escondido CA

14 Bed | 6 Bath
$3,800,000
758 W 20th Street
$3,800,000
Costa Mesa CA

12 Bed | 20 Bath
$52,000,000
24331 Coto de Caza Drive
$52,000,000
Coto de Caza CA

12 Bed | 10 Bath
$4,999,999
577 Sleeping Indian Rd
$4,999,999
Oceanside CA

11 Bed | 8 Bath
$1,325,000
1609 N Parsons Pl
$1,325,000
Santa Ana CA

10 Bed | 9 Bath
$5,800,000
33408 Sandy Creek Lane
$5,800,000
Pine Valley CA

10 Bed | 14 Bath
$29,500,000
15651 Puerta Del Sol
$29,500,000
Rancho Santa Fe CA

10 Bed | 12 Bath
$16,888,888
12 Morning Dove
$16,888,888
Laguna Niguel CA

10 Bed | 8 Bath
$999,000
22228 Crestline Road
$999,000
Palomar Mountain CA

10 Bed | 17 Bath
$87,500,000
1900 Spindrift Dr
$87,500,000
La Jolla CA

10 Bed | 7 Bath
$3,499,900
16108 16110 Old Guejito Grade Rd Road
$3,499,900
Escondido CA

10 Bed | 8 Bath
$95,000,000
32229 Coast Hwy
$95,000,000
Laguna Beach CA

10 Bed | 8 Bath
$2,729,999
28342 Shadowland Circle
$2,729,999
Silverado CA

10 Bed | 12 Bath
$7,625,000
506 Clubhouse Avenue
$7,625,000
Newport Beach CA

10 Bed | 10 Bath
$13,000,000
1337 Gaviota Drive
$13,000,000
Laguna Beach CA

10 Bed | 11 Bath
$14,999,999
525 Sleeping Indian Rd
$14,999,999
Oceanside CA

9 Bed | 5 Bath
$6,498,800
1409 S Pacific Street
$6,498,800
Oceanside CA

9 Bed | 14 Bath
$15,495,000
5893 Winland Hills Dr
$15,495,000
Rancho Santa Fe CA

9 Bed | 13 Bath
$45,000,000
6853 Rancho Valencia Rd.
$45,000,000
Rancho Santa Fe CA

9 Bed | 10 Bath
$30,999,999
701 1st Street
$30,999,999
Coronado CA

9 Bed | 6 Bath
$2,395,000
14671 Mussey Grade Rd
$2,395,000
Ramona CA

9 Bed | 6 Bath
$2,195,000
426 Grant Street
$2,195,000
Oceanside CA

9 Bed | 12 Bath
$17,500,000
7029 Las Colinas
$17,500,000
Rancho Santa Fe CA

9 Bed | 11 Bath
$12,000,000
10 Old Ranch Road
$12,000,000
Laguna Niguel CA

9 Bed | 12 Bath
$12,995,000
21 Ridgeline Drive
$12,995,000
Newport Beach CA

9 Bed | 6 Bath
$5,249,900
5140 Los Robles Drive
$5,249,900
Carlsbad CA

9 Bed | 13 Bath
$45,000,000
6853 Rancho Valencia Road
$45,000,000
Rancho Santa Fe CA

9 Bed | 7 Bath
$2,249,000
7571 Amazon Drive
$2,249,000
Huntington Beach CA

9 Bed | 14 Bath
$15,495,000
5893 3 Winland Hills Dr
$15,495,000
Rancho Santa Fe CA

9 Bed | 6 Bath
$1,590,000
315 W Cypress Avenue
$1,590,000
El Cajon CA

9 Bed | 11 Bath
$8,550,000
26042 Flintlock
$8,550,000
Laguna Hills CA

8 Bed | 9 Bath
$5,595,000
18050 Rancho La Cima Corte
$5,595,000
Rancho Santa Fe CA

8 Bed | 8 Bath
$13,995,000
2800 Ocean Front
$13,995,000
Laguna Beach CA